
Looker Studio dashboards that answer the questions you actually ask
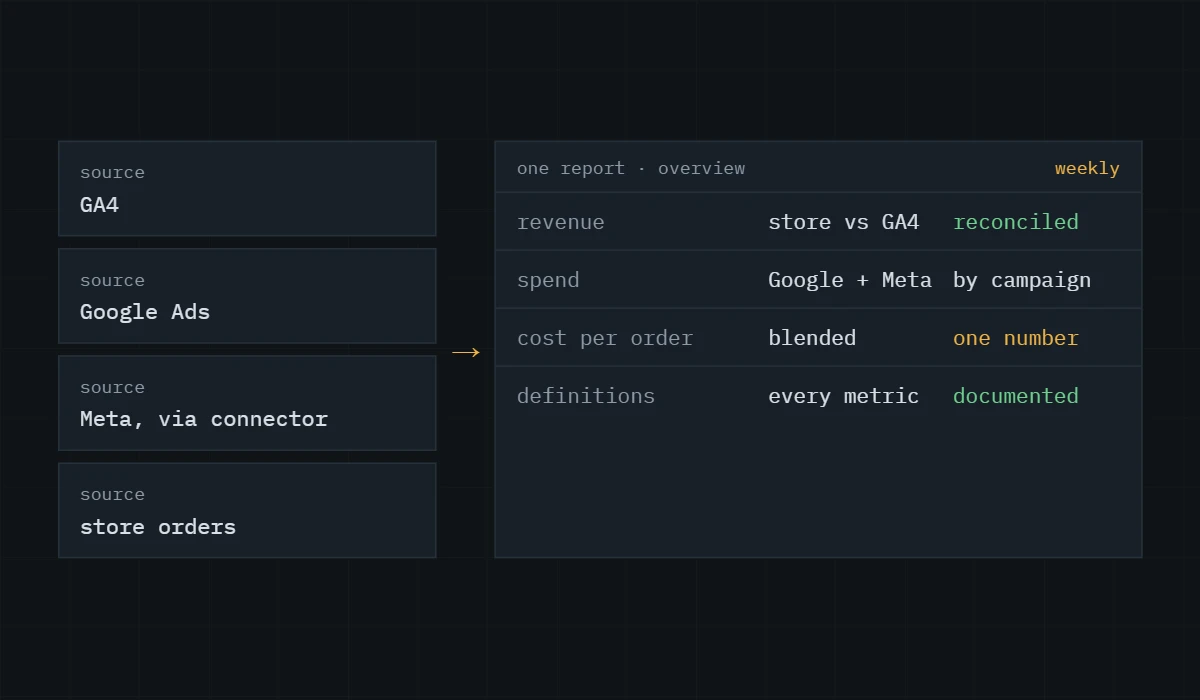
One report with GA4, Google Ads, Meta and your store’s orders side by side, built around the decisions you make every week and short enough that people open it.
The problem you're seeing
You log into four platforms every Monday and copy numbers into a spreadsheet. GA4 says one thing about revenue, Google Ads another, Meta a third. The dashboard an agency built two years ago is slow, half the charts show errors, and nobody trusts it.
Reporting usually breaks for one of two reasons. The data going in is wrong, or the report was built to show everything instead of answering a specific question.
Why it happens
›
Dashboards built on tracking that was never verified, so they show the same wrong numbers faster.
›
Pages with dozens of GA4 charts that run into the GA4 Data API quotas and leave charts showing errors.
›
Blended data sources joined on the wrong key, so spend and conversions don’t line up by date or campaign.
›
Platform numbers compared side by side with no explanation of why they differ: attribution windows, time zones and counting methods.
›
No owner, so filters break and pages drift after every platform change.
What I do
01
Agree the questions the report has to answer and who reads it, before building anything.
02
Check the tracking that feeds it, so the report starts from numbers that match your store or CRM.
03
Connect the sources: GA4, Google Ads and Search Console natively, Meta through a partner connector or a scheduled export, and your order data where it’s available.
04
Build a short report, usually one overview page and a page per channel, with documented calculated fields and date comparisons that work.
05
Hand it over with a short walkthrough recording and, if you want it, scheduled email delivery.
What you get
A Looker Studio report you own, connected to your accounts, with a definitions page that explains every metric and why the platform numbers differ, plus a recording of how to use it.
Who this is for
Store owners and marketing leads who spend Monday mornings copying numbers between platforms, and agencies that need client reporting their clients will actually read.
Questions I get asked
Is Looker Studio free?
Looker Studio is free to use with a Google account. Connectors for non-Google platforms such as Meta are usually paid third-party products, and I’ll tell you up front if your report needs one.
Why do my GA4 charts in Looker Studio show errors?
Usually GA4 API quota limits when one page pulls many GA4 charts at once. Fewer charts per page, extracted data sources, or BigQuery for heavy reports fix it.
Can you fix my existing report instead of building a new one?
Yes, if its structure is sound. Often it’s quicker to rebuild the broken parts and keep the pages people already use.
Who owns the report?
You do. I build it in your Google account or transfer ownership at the end, so it stays with you if we stop working together.
Other services
Start with what you can measure.
Tell me what you want to improve and what you’ve already tried. I’ll reply with what I’d look at first and whether I’m the right person for it.